

Sandisk · FADU
Two faces of the NAND boom: 7x earnings vs 61x
Both are filed under the NAND theme, but one is priced at a cycle-peak multiple and the other assumes growth keeps coming. On a day FADU fell more than 9%, here are the two stocks in numbers.
3-line summary
01Two companies, two different jobs
Sandisk makes NAND chips itself, so when NAND prices rise, profit rises almost directly. FADU is a fabless company (design only) that makes the controller, the brain of an SSD, and its customer count at data centers such as Meta and Google is its earnings. Sandisk went from losses after its spin-off to $12.5 bn of FY26 operating profit in a year. FADU, after three straight loss-making years, is aiming for its first annual profit in 2026.
One caveat: about two-thirds of Sandisk's revenue increase came from higher selling prices. That also means its profit would shrink fastest if prices turned.
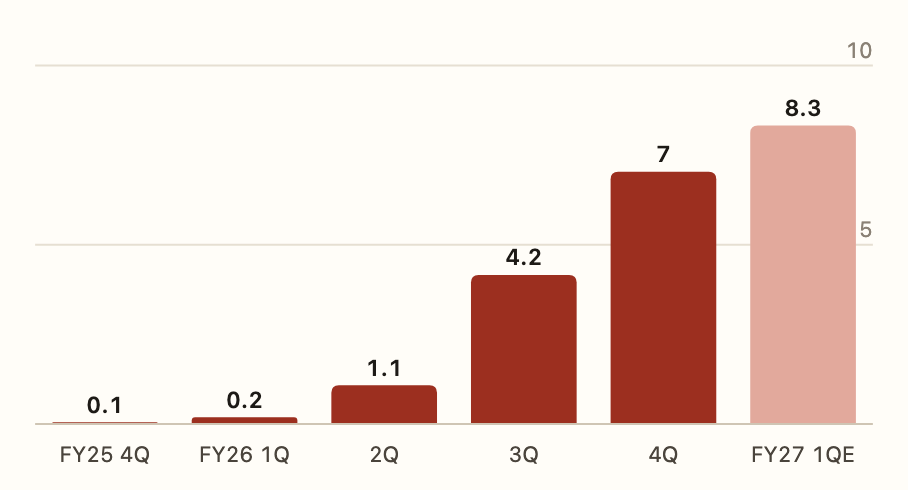
02FADU's earnings are back-loaded
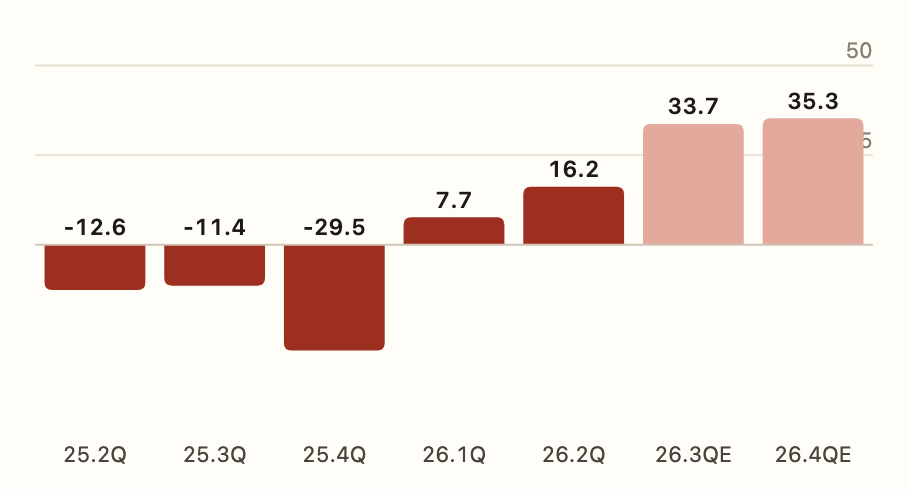
Sandisk's gross margin last quarter was well above the top of guidance (79-81%), yet shares fell after the August results. Prices now respond less to "how much profit" than to "how long it lasts."
03Is the price cheap?
| Metric | Sandisk | FADU |
|---|---|---|
| Estimated P/E | 6.9x | 60.9x |
| P/B | 13.8x | 52.0x |
| Market cap | $215.4 bn | KRW 3.32 tn |
| Avg. target vs. price | +47% | +81% |
P/E is price divided by earnings per share; lower means cheaper relative to profit. Sandisk is a textbook case of a P/E that looks lowest at the cycle peak, while FADU's price is justified only if 2027 profit grows sharply. Sandisk's target range of $1,000-$3,600 is 3.6x wide, and FADU's targets come from just two brokers.
04Key support and resistance on the chart
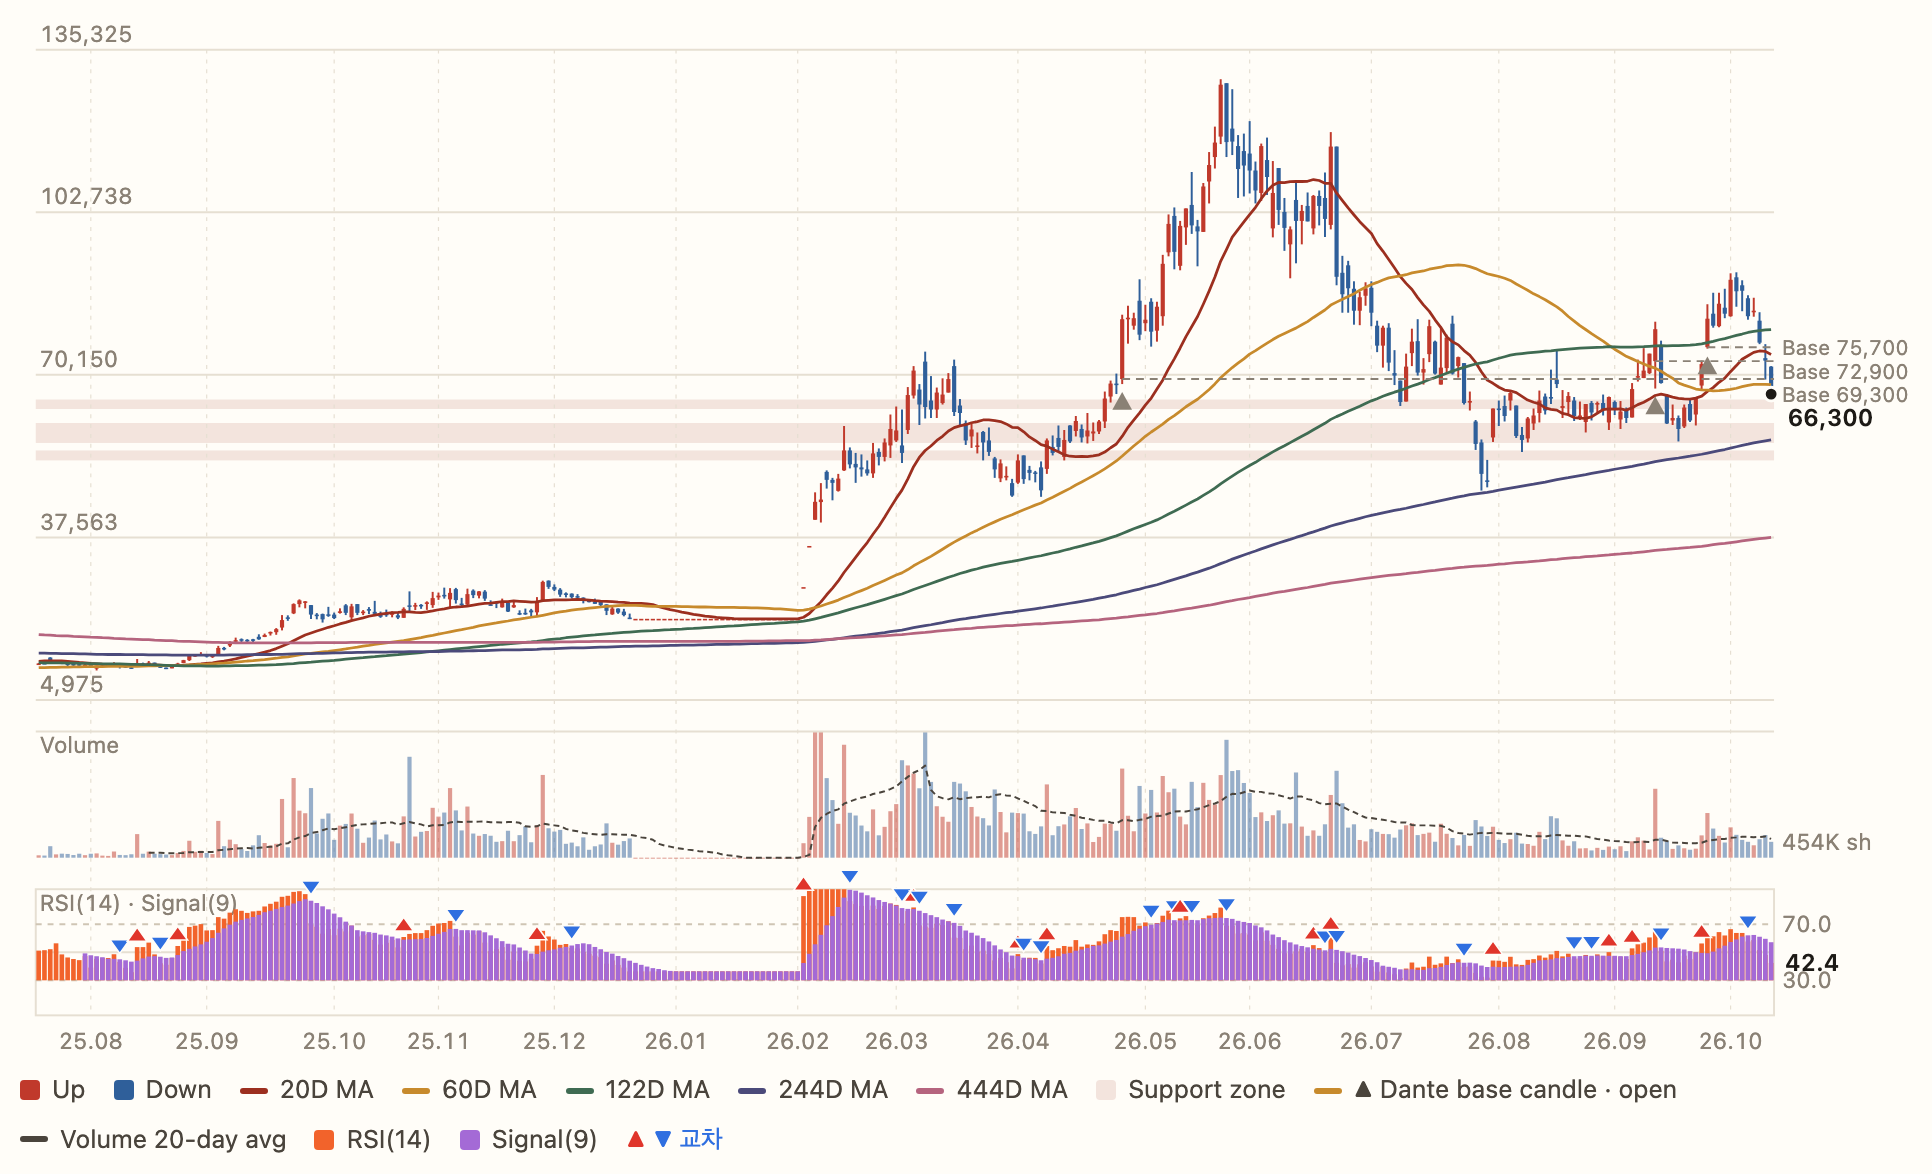
Both stocks follow the same path: a May-June peak, a late-July plunge, a September rebound and an October re-correction. Sandisk sits just above its lower Bollinger Band. FADU lost its 60-day moving average (KRW 68,188) on Oct 14 and is now just above its 200-day (KRW 64,298).
| Stock | Support 1 | Support 2 | Support 3 |
|---|---|---|---|
| Sandisk | $1,400~1,455 | $1,280~1,345 | $1,090~1,190 |
| FADU | 63,300~65,200 | 56,500~60,500 | 53,000~55,000 |
Dante accumulation check. "Dante" is the pen name of Korean YouTuber 주식단테, known for chart methods built on "base candles" (large high-volume bullish candles that mark institutional accumulation). FADU's close on Oct 14 gave up the opens of both September base candles, which by the Dante technique reads as a breakdown signal for the September accumulation attempt. Sandisk has no base candle in the last 150 sessions, so there is no accumulation evidence at current price levels. Trend-break levels are a close below $1,000 for Sandisk and KRW 46,950 for FADU.
05Overall score
Five axes, 5 points each: earnings, valuation, chart, flows and macro. Scores are the analyst's judgment; FADU also requires weighing trial risk separately. Behind the scores: Sandisk is "cheap but in a peak debate," while FADU is "at the start of growth but expensive, with legal risk remaining." The analysis favors a staged approach for both, re-assessing once the earnings reports due within three to four weeks are confirmed. Both stocks have annual volatility above 100%, so daily moves of 6-10% can occur, and US 10-year yields above 5% weigh most on high-multiple names like FADU.
06Dates to watch
This is the summary edition. The full report covers SWOT, price sensitivity, weekly and monthly chart analysis and a Dante checklist for each stock.
Read the full report → 한국어로 보기 →Disclosure. The author did not hold any of the securities mentioned at the time of writing. The author may buy or sell these securities in the future for personal investment purposes. The author does not offer any paid service (subscriptions, paid signals, or one-on-one advice).



댓글 영역